The term central tendency relates to the way in which quantitative data tend to cluster around some value. A measure of central tendency is any of a variety of ways of specifying this "central value". Central tendency is contrasted with statistical dispersion (spread), and together these are the most used properties of distributions. Statistics that measure central tendency can be used in descriptive statistics as a summary statistic for a data set, or as estimators of location parameters of a statistical model.
In the simplest cases, the measure of central tendency is an average of a set of measurements, the word average being variously construed as mean, median, or other measure of location, depending on the context. An average is a measure of the "middle" or "typical" value of a data set. In the most common case, the data set is a list of numbers. The average of a list of numbers is a single number intended to typify the numbers in the list. If all the numbers in the list are the same, then this number should be used. If the numbers are not the same, the average is calculated by combining the numbers from the list in a specific way and computing a single number as being the average of the list.
The term mean has three related meanings:
- The arithmetic mean of a sample,
- The expected value of a random variable, or
- The mean of a probability distribution
The Pythagorean Means
The three most common averages are the Pythagorean means – the arithmetic mean, the geometric mean, and the harmonic mean.
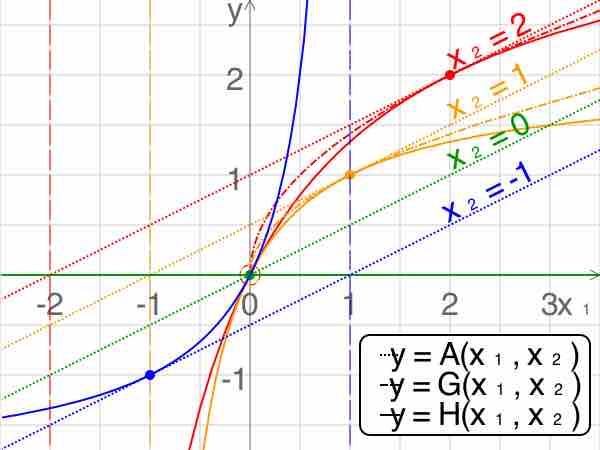
Comparison of Pythagorean Means
Comparison of the arithmetic, geometric and harmonic means of a pair of numbers. The vertical dashed lines are asymptotes for the harmonic means.
The Arithmetic Mean
When we think of means, or averages, we are typically thinking of the arithmetic mean. It is the sum of a collection of numbers divided by the number of numbers in the collection. The collection is often a set of results of an experiment, or a set of results from a survey of a subset of the public. In addition to mathematics and statistics, the arithmetic mean is used frequently in fields such as economics, sociology, and history, and it is used in almost every academic field to some extent. For example, per capita income is the arithmetic average income of a nation's population.
Suppose we have a data set containing the values
If the data set is a statistical population (i.e., consists of every possible observation and not just a subset of them), then the mean of that population is called the population mean. If the data set is a statistical sample (a subset of the population) we call the statistic resulting from this calculation a sample mean. If it is required to use a single number as an estimate for the values of numbers, then the arithmetic mean does this best. This is because it minimizes the sum of squared deviations from the estimate.
The Geometric Mean
The geometric mean is a type of mean or average which indicates the central tendency, or typical value, of a set of numbers by using the product of their values (as opposed to the arithmetic mean which uses their sum). The geometric mean applies only to positive numbers. The geometric mean is defined as the
For instance, the geometric mean of two numbers, say 2 and 8, is just the square root of their product; that is
A geometric mean is often used when comparing different items – finding a single "figure of merit" for these items – when each item has multiple properties that have different numeric ranges. The use of a geometric mean "normalizes" the ranges being averaged, so that no range dominates the weighting, and a given percentage change in any of the properties has the same effect on the geometric mean.
For example, the geometric mean can give a meaningful "average" to compare two companies which are each rated at 0 to 5 for their environmental sustainability, and are rated at 0 to 100 for their financial viability. If an arithmetic mean was used instead of a geometric mean, the financial viability is given more weight because its numeric range is larger - so a small percentage change in the financial rating (e.g. going from 80 to 90) makes a much larger difference in the arithmetic mean than a large percentage change in environmental sustainability (e.g. going from 2 to 5).
The Harmonic Mean
The harmonic mean is typically appropriate for situations when the average of rates is desired. It may (compared to the arithmetic mean) mitigate the influence of large outliers and increase the influence of small values.
The harmonic mean
The harmonic mean is the preferable method for averaging multiples, such as the price/earning ratio in Finance, in which price is in the numerator. If these ratios are averaged using an arithmetic mean (a common error), high data points are given greater weights than low data points. The harmonic mean, on the other hand, gives equal weight to each data point.