Statistics
Textbooks
Boundless Statistics
Correlation and Regression
Regression
Statistics Textbooks Boundless Statistics Correlation and Regression Regression
Statistics Textbooks Boundless Statistics Correlation and Regression
Statistics Textbooks Boundless Statistics
Statistics Textbooks
Statistics
Concept Version 8
Created by Boundless

A Graph of Averages

A graph of averages and the least-square regression line are both good ways to summarize the data in a scatterplot.

Learning Objective

  • Contrast linear regression and graph of averages


Key Points

    • In most cases, a line will not pass through all points in the data. A good line of regression makes the distances from the points to the line as small as possible. The most common method of doing this is called the "least-squares" method.
    • Sometimes, a graph of averages is used to show a pattern between the $y$ and $x$ variables. In a graph of averages, the $x$-axis is divided up into intervals. The averages of the $y$ values in those intervals are plotted against the midpoints of the intervals.
    • The graph of averages plots a typical $y$ value in each interval: some of the points fall above the least-squares regression line, and some of the points fall below that line.

Terms

  • interpolation

    the process of estimating the value of a function at a point from its values at nearby points

  • extrapolation

    a calculation of an estimate of the value of some function outside the range of known values

  • graph of averages

    a plot of the average values of one variable (say $y$) for small ranges of values of the other variable (say $x$), against the value of the second variable ($x$) at the midpoints of the ranges


Full Text

Linear Regression vs. Graph of Averages

Linear (straight-line) relationships between two quantitative variables are very common in statistics. Often, when we have a scatterplot that shows a linear relationship, we'd like to summarize the overall pattern and make predictions about the data. This can be done by drawing a line through the scatterplot. The regression line drawn through the points describes how the dependent variable $y$ changes with the independent variable $x$. The line is a model that can be used to make predictions, whether it is interpolation or extrapolation. The regression line has the form $y=a+bx$, where $y$ is the dependent variable, $x$ is the independent variable, $b$ is the slope (the amount by which $y$ changes when $x$ increases by one), and $a$ is the $y$-intercept (the value of $y$ when $x=0$).

In most cases, a line will not pass through all points in the data. A good line of regression makes the distances from the points to the line as small as possible. The most common method of doing this is called the "least-squares" method. The least-squares regression line is of the form $\hat{y} = a+bx$, with slope $b = \frac{rs_y}{s_x}$ ($r$ is the correlation coefficient, $s_y$ and $s_x$ are the standard deviations of $y$ and $x$). This line passes through the point $(\bar{x},\bar{y})$ (the means of $x$ and $y$).

Sometimes, a graph of averages is used to show a pattern between the $y$ and $x$ variables. In a graph of averages, the $x$-axis is divided up into intervals. The averages of the $y$ values in those intervals are plotted against the midpoints of the intervals. If we needed to summarize the $y$ values whose $x$ values fall in a certain interval, the point plotted on the graph of averages would be good to use.

The points on a graph of averages do not usually line up in a straight line, making it different from the least-squares regression line. The graph of averages plots a typical $y$ value in each interval: some of the points fall above the least-squares regression line, and some of the points fall below that line.

Least Squares Regression Line

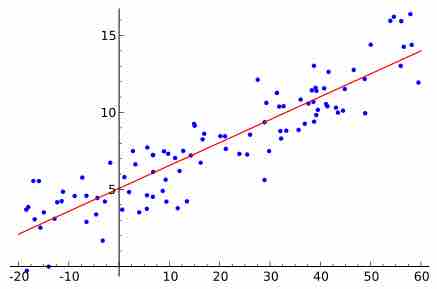
Random data points and their linear regression.

[ edit ]
Edit this content
Prev Concept
Predictions and Probabilistic Models
The Regression Method
Next Concept
Subjects
  • Accounting
  • Algebra
  • Art History
  • Biology
  • Business
  • Calculus
  • Chemistry
  • Communications
  • Economics
  • Finance
  • Management
  • Marketing
  • Microbiology
  • Physics
  • Physiology
  • Political Science
  • Psychology
  • Sociology
  • Statistics
  • U.S. History
  • World History
  • Writing

Except where noted, content and user contributions on this site are licensed under CC BY-SA 4.0 with attribution required.