Statistics
Textbooks
Boundless Statistics
Correlation and Regression
Correlation
Statistics Textbooks Boundless Statistics Correlation and Regression Correlation
Statistics Textbooks Boundless Statistics Correlation and Regression
Statistics Textbooks Boundless Statistics
Statistics Textbooks
Statistics
Concept Version 7
Created by Boundless

Variation and Prediction Intervals

A prediction interval is an estimate of an interval in which future observations will fall with a certain probability given what has already been observed.

Learning Objective

  • Formulate a prediction interval and compare it to other types of statistical intervals.


Key Points

    • A prediction interval bears the same relationship to a future observation that a frequentist confidence interval or Bayesian credible interval bears to an unobservable population parameter.
    • In Bayesian terms, a prediction interval can be described as a credible interval for the variable itself, rather than for a parameter of the distribution thereof.
    • The concept of prediction intervals need not be restricted to the inference of just a single future sample value but can be extended to more complicated cases.
    • Since prediction intervals are only concerned with past and future observations, rather than unobservable population parameters, they are advocated as a better method than confidence intervals by some statisticians.

Terms

  • confidence interval

    A type of interval estimate of a population parameter used to indicate the reliability of an estimate.

  • credible interval

    An interval in the domain of a posterior probability distribution used for interval estimation.


Full Text

In predictive inference, a prediction interval is an estimate of an interval in which future observations will fall, with a certain probability, given what has already been observed. A prediction interval bears the same relationship to a future observation that a frequentist confidence interval or Bayesian credible interval bears to an unobservable population parameter. Prediction intervals predict the distribution of individual future points, whereas confidence intervals and credible intervals of parameters predict the distribution of estimates of the true population mean or other quantity of interest that cannot be observed. Prediction intervals are also present in forecasts; however, some experts have shown that it is difficult to estimate the prediction intervals of forecasts that have contrary series. Prediction intervals are often used in regression analysis.

For example, let's say one makes the parametric assumption that the underlying distribution is a normal distribution and has a sample set $\{X_1, \dots, X_n\}$. Then, confidence intervals and credible intervals may be used to estimate the population mean $\mu$ and population standard deviation $\sigma$ of the underlying population, while prediction intervals may be used to estimate the value of the next sample variable, $X_{n+1}$.

Alternatively, in Bayesian terms, a prediction interval can be described as a credible interval for the variable itself, rather than for a parameter of the distribution thereof.

The concept of prediction intervals need not be restricted to the inference of just a single future sample value but can be extended to more complicated cases. For example, in the context of river flooding, where analyses are often based on annual values of the largest flow within the year, there may be interest in making inferences about the largest flood likely to be experienced within the next 50 years.

Since prediction intervals are only concerned with past and future observations, rather than unobservable population parameters, they are advocated as a better method than confidence intervals by some statisticians.

Prediction Intervals in the Normal Distribution

Given a sample from a normal distribution, whose parameters are unknown, it is possible to give prediction intervals in the frequentist sense -- i.e., an interval $[a, b]$ based on statistics of the sample such that on repeated experiments, $X_{n+1}$ falls in the interval the desired percentage of the time.

A general technique of frequentist prediction intervals is to find and compute a pivotal quantity of the observables $X_1, \dots, X_n, X_{n+1}$ – meaning a function of observables and parameters whose probability distribution does not depend on the parameters – that can be inverted to give a probability of the future observation $X_{n+1}$ falling in some interval computed in terms of the observed values so far. The usual method of constructing pivotal quantities is to take the difference of two variables that depend on location, so that location cancels out, and then take the ratio of two variables that depend on scale, so that scale cancels out. The most familiar pivotal quantity is the Student's $t$-statistic, which can be derived by this method.

A prediction interval $[l, u]$ for a future observation $X$ in a normal distribution $N(\mu, \sigma^2)$ with known mean and variance may easily be calculated from the formula:

$\displaystyle \begin{aligned} \gamma&=P(l< X< u) \\ &=P\left(\frac{l-\mu}{\sigma}< \frac{X-\mu}{\sigma}< \frac{u-\mu}{\sigma}\right)\\& =P\left(\frac{l-\mu}{\sigma}< Z< \frac{u-\mu}{\sigma}\right) \end{aligned}$ 

where:

$\displaystyle Z=\frac { X-\mu }{ \sigma }$

the standard score of X, is standard normal distributed. The prediction interval is conventionally written as:

$\left[ \mu -z\sigma ,\quad \mu +z\sigma \right]$

For example, to calculate the 95% prediction interval for a normal distribution with a mean ($\mu$) of 5 and a standard deviation ($\sigma$) of 1, then $z$ is approximately 2. Therefore, the lower limit of the prediction interval is approximately $5 - (1\cdot2) = 3$, and the upper limit is approximately 7, thus giving a prediction interval of approximately 3 to 7.

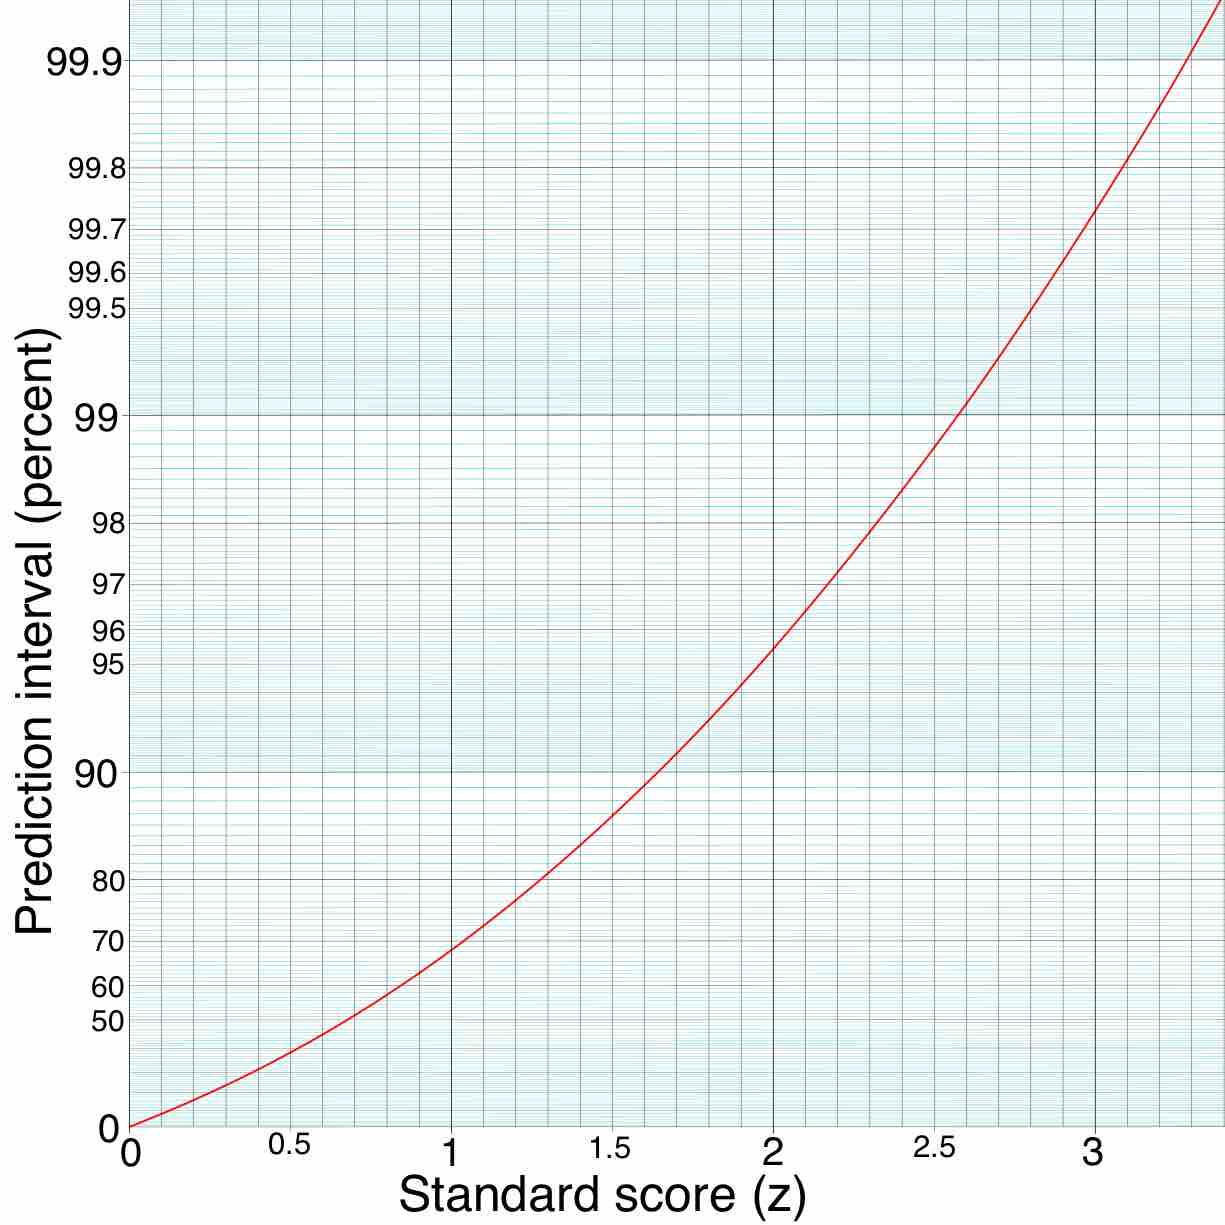
Standard Score and Prediction Interval

Prediction interval (on the $y$-axis) given from $z$ (the quantile of the standard score, on the $x$-axis). The $y$-axis is logarithmically compressed (but the values on it are not modified).

[ edit ]
Edit this content
Prev Concept
Other Types of Correlation Coefficients
Rank Correlation
Next Concept
Subjects
  • Accounting
  • Algebra
  • Art History
  • Biology
  • Business
  • Calculus
  • Chemistry
  • Communications
  • Economics
  • Finance
  • Management
  • Marketing
  • Microbiology
  • Physics
  • Physiology
  • Political Science
  • Psychology
  • Sociology
  • Statistics
  • U.S. History
  • World History
  • Writing

Except where noted, content and user contributions on this site are licensed under CC BY-SA 4.0 with attribution required.