When psychologists want to test a research hypothesis, they will usually need to use statistical inference. Statistical inference makes propositions about a population by using a sample, which is data drawn from that population.
Understanding Populations and Samples
Suppose we are interested in studying whether there is a difference between the annual income of women over 30 who have a college education as compared with those who do not. A “population” includes the complete set of people (or items) with the characteristic we wish to understand. In this case, our population is all women over 30. However, because it would be very difficult (and very costly in terms of time and money) to gather information from every woman over 30, we need to take a representative sample of the population, and use that sample to infer something about the characteristics of the entire population. A “sample” is a set of observations derived from a subset of a population.
In our example above, it would be very difficult to collect information on the entire population (women over 30), but in some cases, getting information on the entire population would be impossible. Such populations include, for example, the length of all supermarket checkout lines, the height of every person in the world, or the age at which every child on Earth first began to walk. Because of this, it is important to note that a population can range from a relatively small, specific set of numbers (all female students at Harvard University) to an infinitely large set of numbers which could never be collected (the height of every person in the world). This is the practical reason why that we must collect samples.
Statistics and Parameters
When we collect our sample, we compute numerical values that summarize the data in our sample. For example, when we collect a sample of women over 30, we might collect their mean income and mean education level. These values are called statistics. The corresponding values in the population are called parameters. Statistical inference therefore literally helps us make inferences about the characteristics of populations (their parameters) from characteristics of our sample (statistics). Because it is typically impossible to study an entire population, a sample gets us as close as possible, and statistical inference enables us to infer the characteristics of our population.
Sample Representation
Because a sample is the key to better understanding characteristics of the population we are interested in, a researcher must put considerable thought into how he or she will sample from that population. Researchers will ideally want to strive to ensure that their sample is truly random. In a “random sample,” every element of the population has an equal chance of being included in the sample. Collecting a true random sample helps the researcher ensure that the statistics they are using to make inferences about a population are accurate. For example, to collect a random sample of women over 30 for our study above, we may get a census list of women over 30 in the population and send a survey about income to every 10th woman on the list.
Although random samples are the ideal, researchers will often end up using samples of convenience instead (e.g., volunteers from an Introduction to Psychology class) because truly random samples are difficult to obtain and often impractical. Although convenience samples are not as ideal as a random sample, they are easy to collect, and depending on the research question, may provide an good enough approximation of the population being studied.
It is also important to note that sample size is a crucial factor to take into account when conducting a study. The bigger the sample the researcher collects, the closer the researcher gets to getting more accurate estimates of population parameters. Accordingly, depending on several other factors, larger samples can also give the researcher a greater chance that their results will be statistically significant, meaning that it can increase their power to detect an effect.
The Normal Distribution
For a distribution that is perfectly normally distributed, the mean is equal to the median, as well as the mode. The normal distribution is expressed in terms of standard deviation around the mean, where 68% of values lie within one standard deviation of the mean, and where approximately 96% of the values lie within two standard deviations of the mean.
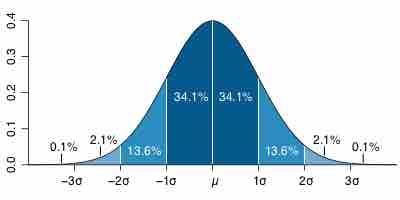
Normal distribution
The normal, or Gaussian, distribution of values (also known as the bell curve). This occurs when the mean, median, and mode are equivalent, or approximately equivalent.
The reason the normal distribution is so important is because most inferential statistics are based on the assumption that the variable we are measuring is normally distributed. If our variable is normally distributed, that gives us confidence that if we were to obtain the whole population of observations for that variable, the resulting distribution would also be normally distributed, and therefore the inferences we draw (using statistics) are accurate.
Inferential Statistical Tests
What type of inferential statistics we use will inevitably depend on our research question and our type of data. There are many types of inferential statistical tests, but perhaps the simplest is the t-test, which determines whether there is a significant difference between two means. For example, we may want to compare SAT scores between high school senior women and men to see if there is a difference. We would first collect our sample from the population, ideally a random one. Next, we would collect their SAT scores and compute the mean SAT score for women and the mean SAT score for men. Then we would run an independent samples t-test, which would tell us whether there is a significant difference between mean SAT scores for men versus women.
However, there are many other types of inferential statistics that can be used, some of which test differences in means (t-tests), others which test differences in variances (analysis of variance), and others which use more sophisticated statistical models (General Linear Models). It is up to the researcher to decide which statistical test is the correct fit for their data.