Psychology
Textbooks
Boundless Psychology
Researching Psychology
Analyzing and Interpreting Data
Psychology Textbooks Boundless Psychology Researching Psychology Analyzing and Interpreting Data
Psychology Textbooks Boundless Psychology Researching Psychology
Psychology Textbooks Boundless Psychology
Psychology Textbooks
Psychology
Concept Version 16
Created by Boundless

Basic Descriptive Statistics

Histogram

Histogram

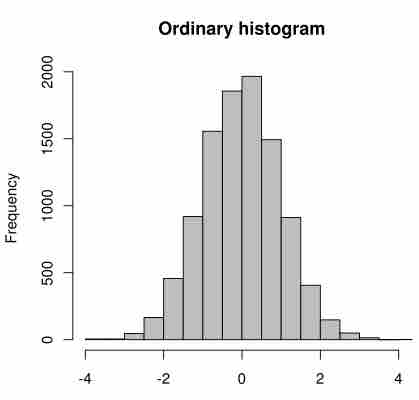
This histogram displays normally distributed data (it is shaped like a symmetrical bell, meaning the median is roughly equal to the mean). Each column represents the number of data points of observations within that interval, or "bin." For example, the first two intervals, or "bins," are on the x-axis, and frequencies are on the y-axis.

Source

    Boundless vets and curates high-quality, openly licensed content from around the Internet. This particular resource used the following sources:

    "900px-Cumulative_vs_normal_histogram.svg.png."
    https://en.wikipedia.org/wiki/Histogram Wikipedia CC BY-SA 3.0.

Related Terms

  • ratio
  • ordinal
  • standard deviation
  • Subjects
    • Accounting
    • Algebra
    • Art History
    • Biology
    • Business
    • Calculus
    • Chemistry
    • Communications
    • Economics
    • Finance
    • Management
    • Marketing
    • Microbiology
    • Physics
    • Physiology
    • Political Science
    • Psychology
    • Sociology
    • Statistics
    • U.S. History
    • World History
    • Writing

    Except where noted, content and user contributions on this site are licensed under CC BY-SA 4.0 with attribution required.