A decision tree is a decision support tool that uses a tree-like graph or model of decisions and their possible consequences, including chance event outcomes, resource costs, and utility. They help to identify the strategy that is most likely to reach the declared goal. For an investor, this may be used to help determine which bond to buy in order to get the highest expected return with only a certain amount of risk. Decision trees are set up much like an organizational flow chart.
Decision Tree
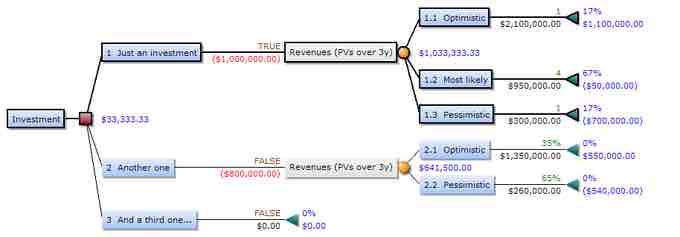
This decision tree highlights the outcomes of different investing strategies. Next to the terminal nodes is blue text with the yield and gain.
Unlike a flow chart, a decision tree consists of three types of nodes:
- Decision nodes - commonly represented by squares – the user gets to decide which branch to take.
- Chance nodes - represented by circles – the branch taken is determined by probabilities.
- End nodes - represented by triangles – there are no more branches extending from the node, and the final value of the strategy is listed.
In order to set up and use a decision tree, the user must first list each decision point. For example, in , the investor first listed the number of investments that could be made (1, 2, or 3) and then the options for the likely payoffs (optimistic, most likely, etc.). Each end node was given a value. Working from left to right (or top to bottom), the investor determined that making one investment has the highest expected value ($641,500 vs. $0). Therefore, the investor will definitely choose to make one investment. Then, to determine the payoff, the probabilities and yields are listed. This is a chance node, so the investor doesn't know how much he will earn from the investment, but does know his options.
Decision trees can become very complex, so determining the correct strategy becomes more difficult. Decision trees are always solved from the top to the bottom (or left to right) and is just a process of picking the most optimal path or seeing the likely payoffs.
There may not be an idea strategy shown on the decision tree. In that case, the decision tree is still useful as a way to map out all of the possible strategies with their costs and benefits.