Finance
Textbooks
Boundless Finance
Introduction to the Cost of Capital
Approaches to Calculating the Cost of Capital
Finance Textbooks Boundless Finance Introduction to the Cost of Capital Approaches to Calculating the Cost of Capital
Finance Textbooks Boundless Finance Introduction to the Cost of Capital
Finance Textbooks Boundless Finance
Finance Textbooks
Finance
Concept Version 5
Created by Boundless

The SML Approach

The SML is the graphical representation of CAPM used to determine if an asset is priced to offer a reasonable expected return for the risk.

Learning Objective

  • Analyze assets using the Security Market Line Approach


Key Points

    • The SML graphs the relationship between risk β (beta) and expected return.
    • All correctly priced assets lie on the SML.
    • If a security is priced above the SML, it is undervalued. If it is priced below the SML, it is overvalued.

Term

  • slope

    The ratio of the vertical and horizontal distances between two points on a line; zero if the line is horizontal, undefined if it is vertical.


Example

    • The current risk-free rate is 5%. The market is expected to return 12% next year. The beta of the security is 1.9. Expected return = 5% + 1.9*(12% - 5%) Expected return = 18.3% We expect the asset to return 18.3% and be plotted on the SML. However, the current real rate of return for the asset is 19%. The asset would be plotted above the SML. Therefore, it is undervalued and should be bought.

Full Text

The SML Approach

The Security Market Line (SML) is the graphical representation of the capital asset pricing model (CAPM), with the x-axis representing the risk (beta), and the y-axis representing the expected return. It graphs the relationship between beta (β) and expected return, i.e. it shows expected return as a function of β. The y-intercept of the SML is equal to the risk-free interest rate, while the slope is equal to the market risk premium (the market's rate of return minus the risk-free rate). The slope also represents the risk-return tradeoff at a given time. The SML is applicable to any asset.

SML Equation

The SML is the graphical representation of CAPM, and thus is found using the same equation.

Applications of the SML

Individual assets that are correctly priced are plotted on the SML. In the ideal world of CAPM, all assets are correctly priced and thus lie on the SML. In real market scenarios, we are able to use the SML graph to determine if an asset being considered for a portfolio offers a reasonable expected return for the risk. If an asset is priced at a point above the SML, it is undervalued, since for a given amount of risk, it yields a higher return. Conversely, an asset priced below the SML is overvalued, since for a given amount of risk, it yields a lower return.
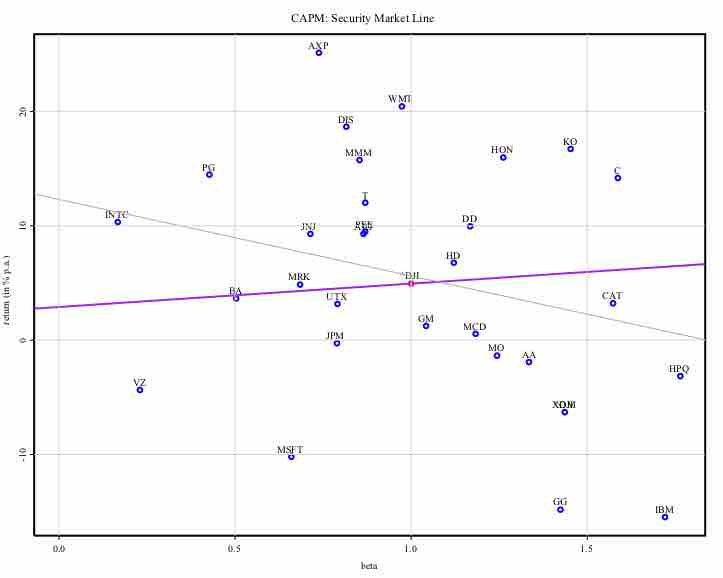
CAPM-SML

The Security Market Line for the Dow Jones Industrial Average over a 3 year period, with the x-axis representing beta and the y-axis representing expected return.

Another way to think about real market applications of the SML would be in terms of buying and selling securities. If an asset is priced above the SML, and thus undervalued, it should be bought. If an asset is priced below the SML, and thus overvalued, it should be sold.

[ edit ]
Edit this content
Prev Concept
The Capital Asset Pricing Model
Discounted Cash Flow Approach
Next Concept
Subjects
  • Accounting
  • Algebra
  • Art History
  • Biology
  • Business
  • Calculus
  • Chemistry
  • Communications
  • Economics
  • Finance
  • Management
  • Marketing
  • Microbiology
  • Physics
  • Physiology
  • Political Science
  • Psychology
  • Sociology
  • Statistics
  • U.S. History
  • World History
  • Writing

Except where noted, content and user contributions on this site are licensed under CC BY-SA 4.0 with attribution required.