Economics
Textbooks
Boundless Economics
Introducing Supply and Demand
Demand
Economics Textbooks Boundless Economics Introducing Supply and Demand Demand
Economics Textbooks Boundless Economics Introducing Supply and Demand
Economics Textbooks Boundless Economics
Economics Textbooks
Economics
Concept Version 9
Created by Boundless

Demand Schedules and Demand Curves

A demand curve depicts the price and quantity combinations listed in a demand schedule.

Learning Objective

  • Describe the relationship between demand curves and demand schedules


Key Points

    • Demand curves are a graphical representation of a demand schedule, which is the table view of an economic agents' price to quantity relationship.
    • Demand curves embody preferences, substitution potential and income, as well as other characteristics that influence an economic agent's ability to assess willingness to pay at a specific point in time for goods and services.
    • Demand curves may be linear or curved.
    • Aggregate demand is the sum of the quantity demanded for a specific price over a group of economic agents.

Term

  • equilibrium

    The condition of a system in which competing influences are balanced, resulting in no net change.


Full Text

The demand curve is a graphical representation depicting the relationship between a commodity's different price levels and quantities which consumers are willing to buy. The curve can be derived from a demand schedule, which is essentially a table view of the price and quantity pairings that comprise the demand curve.

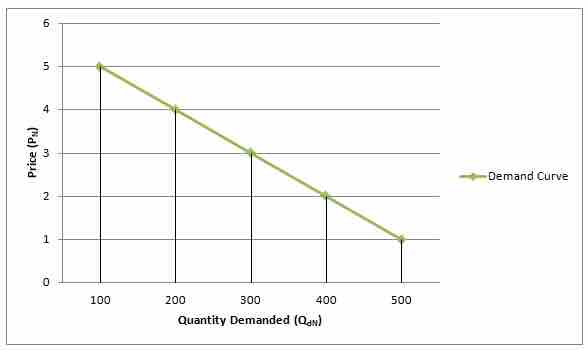
Demand Schedule and Curve

The demand curve is the graphical representation of the economic entity's willingness to pay for a good or service. It is derived from a demand schedule, which is the table view of the price and quantity pairs that comprise the demand curve.

Given that in most cases, as the price of a good increases, agents will likely decrease consumption and substitute away to another good or service, the demand curve embodies a negative price to quantity relationship. The curve typically slopes downward from left to right; though there are some goods and services that exhibit an upward sloping demand, these goods and services are characterized as abnormal.

The demand curve of an individual agent can be combined with that of other economic agents to depict a market or aggregate demand curve. Using a demand schedule, the quantity demanded per each individual can be summed by price, resulting in an aggregate demand schedule that provides the total demanded specific to a given price level. The plotting of the aggregated quantity to price pairings is what is referred to as an aggregate demand curve. In this manner, the demand curve for all consumers together follows from the demand curve of every individual consumer.

The demand curve in combination with the supply curve provides the market clearing or equilibrium price and quantity relationship. This is found at the intersection or point at which the supply and demand curves cross each other.

[ edit ]
Edit this content
Prev Concept
The Law of Demand
Market Demand
Next Concept
Subjects
  • Accounting
  • Algebra
  • Art History
  • Biology
  • Business
  • Calculus
  • Chemistry
  • Communications
  • Economics
  • Finance
  • Management
  • Marketing
  • Microbiology
  • Physics
  • Physiology
  • Political Science
  • Psychology
  • Sociology
  • Statistics
  • U.S. History
  • World History
  • Writing

Except where noted, content and user contributions on this site are licensed under CC BY-SA 4.0 with attribution required.