Inflation is the persistent rise in the general price level of goods and services. Disinflation is a decline in the rate of inflation; it is a slowdown in the rise in price level. As an example, assume inflation in an economy grows from 2% to 6% in Year 1, for a growth rate of four percentage points. In Year 2, inflation grows from 6% to 8%, which is a growth rate of only two percentage points. The economy is experiencing disinflation because inflation did not increase as quickly in Year 2 as it did in Year 1, but the general price level is still rising. Disinflation is not to be confused with deflation, which is a decrease in the general price level.
Causes
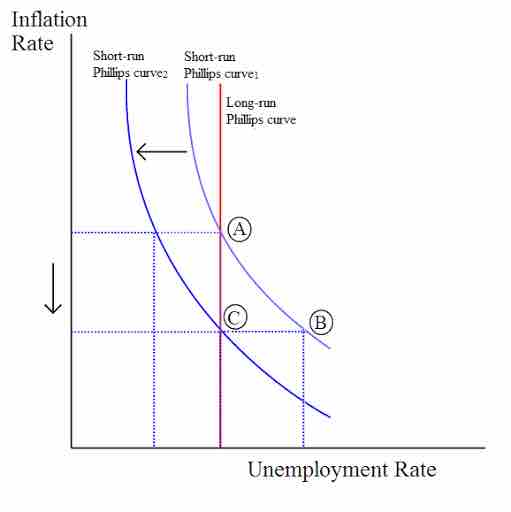
Disinflation can be caused by decreases in the supply of money available in an economy. It can also be caused by contractions in the business cycle, otherwise known as recessions. The Phillips curve can illustrate this last point more closely. Consider an economy initially at point A on the long-run Phillips curve in . Suppose that during a recession, the rate that aggregate demand increases relative to increases in aggregate supply declines. This reduces price levels, which diminishes supplier profits. As profits decline, employers lay off employees, and unemployment rises, which moves the economy from point A to point B on the graph. Eventually, though, firms and workers adjust their inflation expectations, and firms experience profits once again. As profits increase, employment also increases, returning the unemployment rate to the natural rate as the economy moves from point B to point C. The expected rate of inflation has also decreased due to different inflation expectations, resulting in a shift of the short-run Phillips curve.
Disinflation
Disinflation can be illustrated as movements along the short-run and long-run Phillips curves.
Inflation vs. Deflation vs. Disinflation
To illustrate the differences between inflation, deflation, and disinflation, consider the following example. Assume the following annual price levels as compared to the prices in year 1:
- Year 1: 100% of Year 1 prices
- Year 2: 104% of Year 1 prices
- Year 3: 106% of Year 1 prices
- Year 4: 107% of Year 1 prices
- Year 5: 105% of Year 1 prices
As the economy moves through Year 1 to Year 4, there is a continued growth in the price level. This is an example of inflation; the price level is continually rising. However, between Year 2 and Year 4, the rise in price levels slows down. Between Year 2 and Year 3, the price level only increases by two percentage points, which is lower than the four percentage point increase between Years 1 and 2. The trend continues between Years 3 and 4, where there is only a one percentage point increase. This is an example of disinflation; the overall price level is rising, but it is doing so at a slower rate.
Between Years 4 and 5, the price level does not increase, but decreases by two percentage points. This is an example of deflation; the price rise of previous years has reversed itself.