Graphics can be created by hand using simple everyday tools such as graph paper, pencils, markers, and rulers. However, today they are more often created using computer software, which is often both faster and easier. They can be created with graphing calculators.
Graphs are often created using computer software. Both open source computer and proprietary programs can be used for this purpose.
For example, GraphCalc (see ) is an open source computer program that runs in Microsoft Windows and Linux that provides the functionality of a graphing calculator. GraphCalc includes many of the standard features of graphing calculators, but also includes some higher-end features.
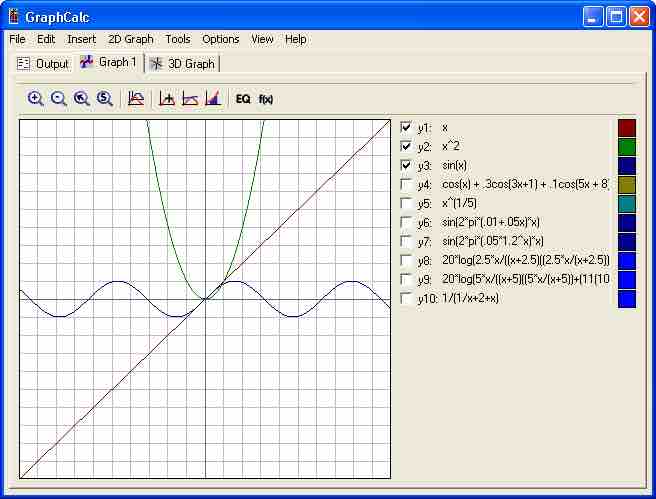
GraphCalc
Screenshot of GraphCalc
a) High resolution: Graphing calculator screens have a resolution typically less than 120 by 90 pixels, whereas computer monitors typically display 1280 by 1024 pixels or more.
b) Speed: Modern computers are considerably faster than handheld graphing calculators.
c) Three-dimensional graphing: While high-end graphing calculators can graph in 3-D, GraphCalc benefits from modern computers' memory, speed, and graphics acceleration.
Mathematica is an example of proprietary computational software program used in scientific, engineering, and mathematical fields and other areas of technical computing. It also includes tools for visualizing and analyzing graphs.
A graphing calculator (see ) typically refers to a class of handheld scientific calculators that are capable of plotting graphs, solving simultaneous equations, and performing numerous other tasks with variables. Most popular graphing calculators are also programmable, allowing the user to create customized programs, typically for scientific/engineering and education applications. Due to their large displays intended for graphing, they can also accommodate several lines of text and calculations at a time.
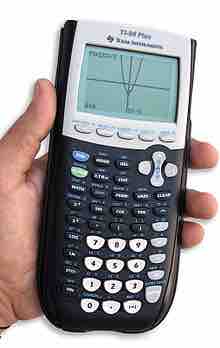
Graphing Calculator
Calculators graph curves by drawing each pixel as a linear approximation of the function.
Some of the more recent graphing calculators are capable of color output, and also feature animated and interactive drawing of math plots (2D and 3D), other figures such as animated geometry theorems, preparation of documents which can include these plots and drawings, etc. This is giving the new graphing calculators a presence even in high school courses where they were formerly disallowed. Some calculator manufacturers also offer computer software for emulating and working with handheld graphing calculators.
Many graphing calculators can be attached to devices like electronic thermometers, pH gauges, weather instruments, decibel and light meters, accelerometers, and other sensors and therefore function as data loggers, as well as WiFi or other communication modules for monitoring, polling and interaction with the teacher. Student laboratory exercises with data from such devices enhances learning of math, especially statistics and mechanics.