Algebra
Textbooks
Boundless Algebra
Exponents, Logarithms, and Inverse Functions
The Real Number e
Algebra Textbooks Boundless Algebra Exponents, Logarithms, and Inverse Functions The Real Number e
Algebra Textbooks Boundless Algebra Exponents, Logarithms, and Inverse Functions
Algebra Textbooks Boundless Algebra
Algebra Textbooks
Algebra
Concept Version 12
Created by Boundless

Graphs of Exponential Functions, Base e

The function $f(x) = e^x$ is a basic exponential function with some very interesting properties.

Learning Objective

  • Identify important properties about the graph of $f(x) = e^x$


Key Points

    • The function $f(x)=e^{x}$ is a function which is very important in calculus. It appears in many applications. 
    • The exponential function arises whenever a quantity grows or decays at a rate proportional to its current value.
    • The graph of $y=e^x$lies between the graphs of $y=2^x$ and $y=3^x$.

Terms

  • tangent

    A straight line touching a curve at a single point without crossing it.

  • exponential function

    Any function in which an independent variable is in the form of an exponent; they are the inverse functions of logarithms.

  • asymptote

    A line that a curve approaches arbitrarily closely, as it extends toward infinity.


Full Text

Overview of $e^{x}$

The basic exponential function, sometimes referred to as the exponential function, is
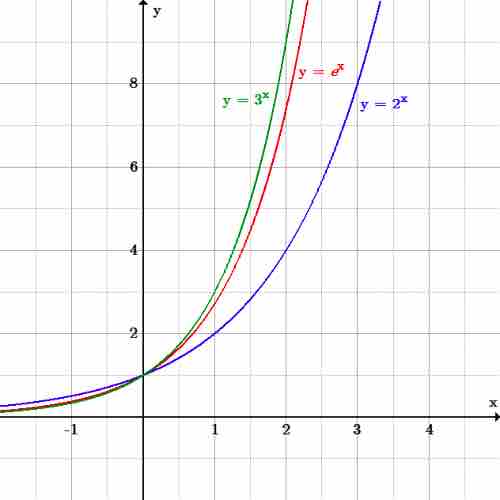
 $f(x)=e^{x}$ where $e$ is the number (approximately 2.718281828) described previously. Its graph lies between the graphs of $2^x$ and $3^x$. The graph's $y$-intercept is the point $(0,1)$, and it also contains the point $(1,e).$ Sometimes it is written as $y=\exp (x)$.

The graphs of $2^x$, $e^x$, and $3^x$

The graph of $y=e^x$ lies between that of $y=2^x$ and $y=3^x$ .

The graph of $y=e^{x}$ is upward-sloping, and increases faster as $x$ increases. The graph always lies above the $x$-axis, but gets arbitrarily close to it for negative $x$; thus, the $x$-axis is a horizontal asymptote. The graph of $e^x$ has the property that the slope of the tangent line to the graph at each point is equal to its $y$-coordinate at that point. $y=e^x$ is the only function with this property.

A Model For Proportional Change

The exponential function is used to model a relationship in which a constant change in the independent variable gives the same proportional change (i.e., percentage increase or decrease) in the dependent variable. If the change is positive, this is called exponential growth and if it is negative, it is called exponential decay. For example, because a radioactive substance decays at a rate proportional to the amount of the substance present, the amount of the substance present at a given time can be modeled with an exponential function. Also, because the the growth rate of a population of bacteria in a petri dish is proportional to its size, the number of bacteria in the dish at a given time can be modeled by an exponential function such as $y=Ae^{kt}$ where $A$ is the number of bacteria present initially (at time $t=0$) and $k$ is a constant called the growth constant. 

[ edit ]
Edit this content
Prev Concept
The Number e
Natural Logarithms
Next Concept
Subjects
  • Accounting
  • Algebra
  • Art History
  • Biology
  • Business
  • Calculus
  • Chemistry
  • Communications
  • Economics
  • Finance
  • Management
  • Marketing
  • Microbiology
  • Physics
  • Physiology
  • Political Science
  • Psychology
  • Sociology
  • Statistics
  • U.S. History
  • World History
  • Writing

Except where noted, content and user contributions on this site are licensed under CC BY-SA 4.0 with attribution required.