

PowerPoint 2010
Working with Charts
Modifying charts with chart tools
Video: Modifying Charts in PowerPoint 2010
 Watch the video (1:55).
There are many ways to customize and organize your charts. For example, PowerPoint allows you to change the chart type, rearrange a chart's data, and even change the layout and style.
Once you insert a chart, a set of Chart Tools will appear on the Ribbon. These are only visible when the chart is selected. You can use the three tabs grouped under Chart Tools to modify your chart.
 The Chart Tools tab
To change the chart type:
- From the Design tab, click the Change Chart Type command. A dialog box will appear.
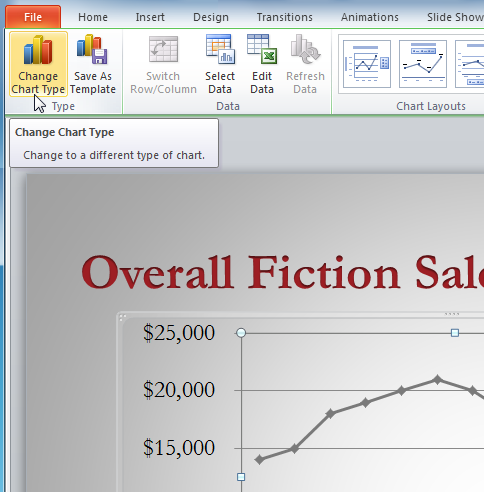 The Change Chart Type command
 - Select the desired chart type.
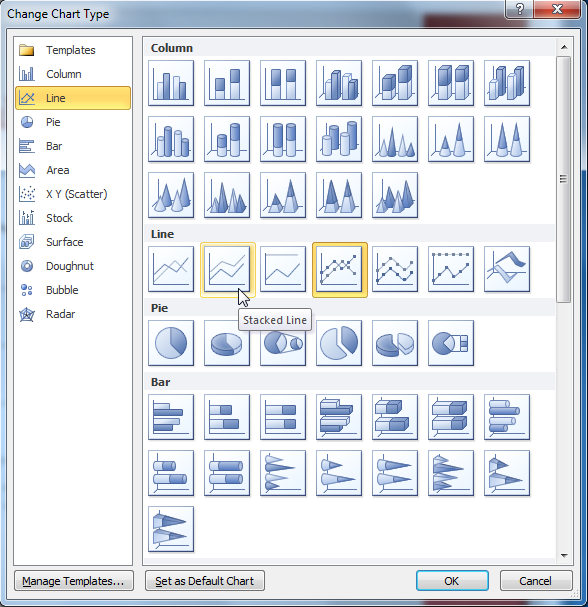 Choosing a new chart type
 - Click OK. The chart will update to reflect the new chart type.
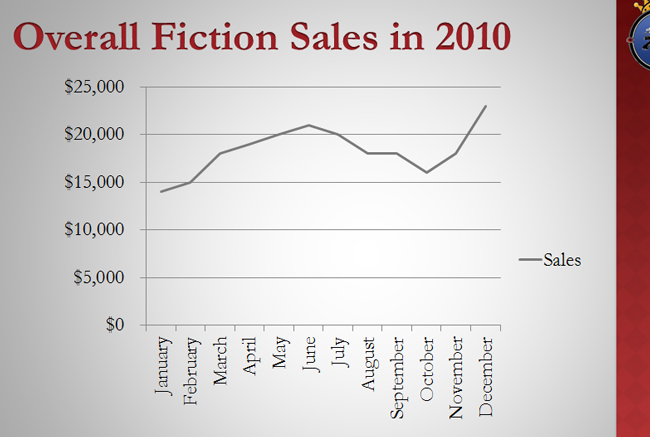 The modified chart
To switch row and column data:
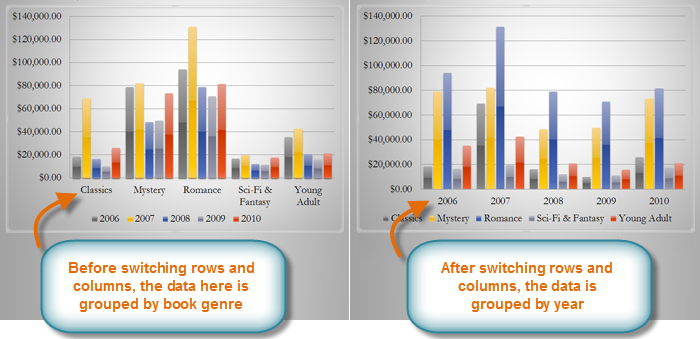
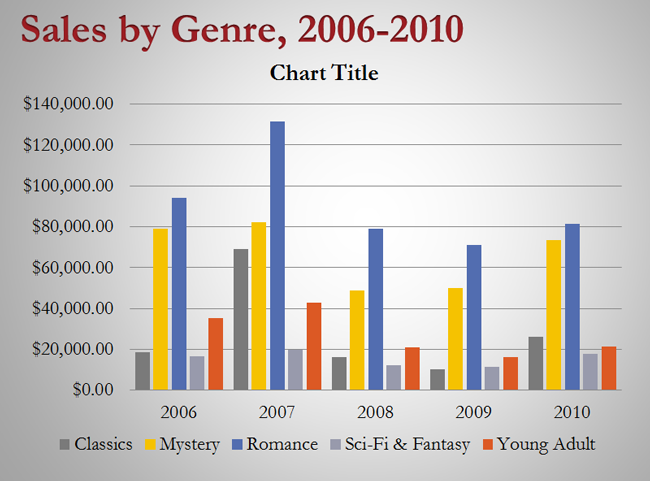
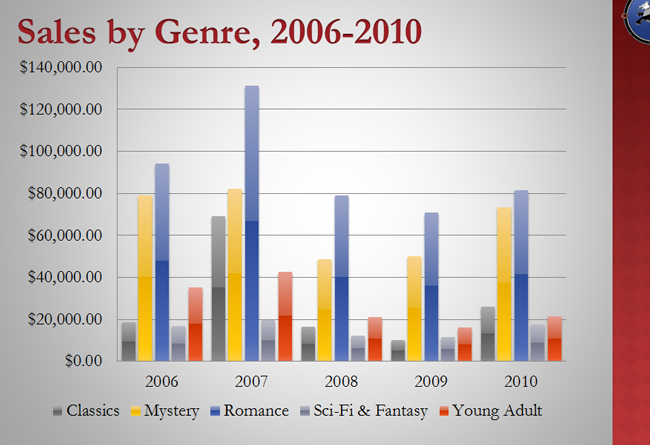
Sometimes when you create a chart, the data may not be grouped the way you want it to. In the clustered column chart below on the left, the Book Genre Sales statistics are grouped by Genre, with a column for each year. However, you could also switch the row and column data so the chart will group the statistics by year, with columns for each genre, as in the chart on the right. In both cases, the chart contains the same data; it's just organized differently.
 Sales Chart before and after switching row and column data
- Select the chart.
- From the Chart Tools Design tab, select the Edit command in the Data group. The Excel placeholder will open.
- Return to your PowerPoint slide. Select the Switch Row/Column command in the Data group.
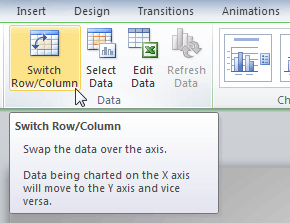 The Switch Row/Column Command
 - The chart will adjust the data.
To change the chart layout:
- Select the Chart Tools Design tab.
- Click the More drop-down arrow in the Chart Layouts group to see all of the available layouts.
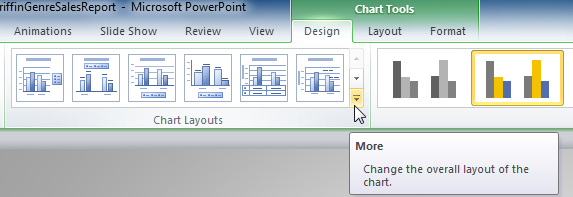 The More Layouts drop-down arrow
 - Select the desired layout.
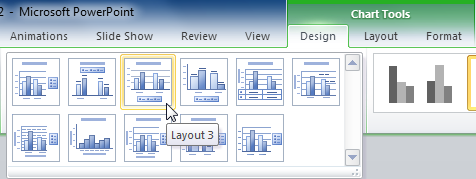 Selecting a new layout
 - The chart will update to reflect the new layout.
 The modified chart
Some layouts include things like chart titles and legend labels. To change them, just place the insertion point in the text and begin typing.
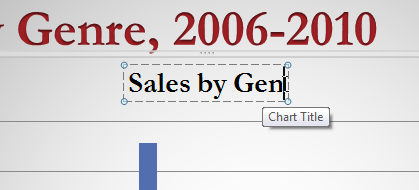 Changing the chart title
To change the chart style:
- Select the Chart Tools Design tab.
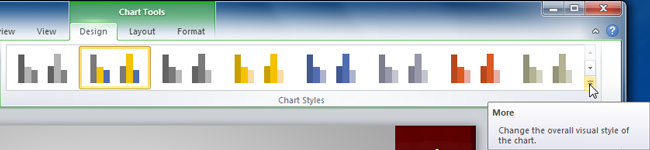 The Chart Styles group
 - Click the More drop-down arrow in the Chart Styles group to see all of the available styles.
- Select the desired style.
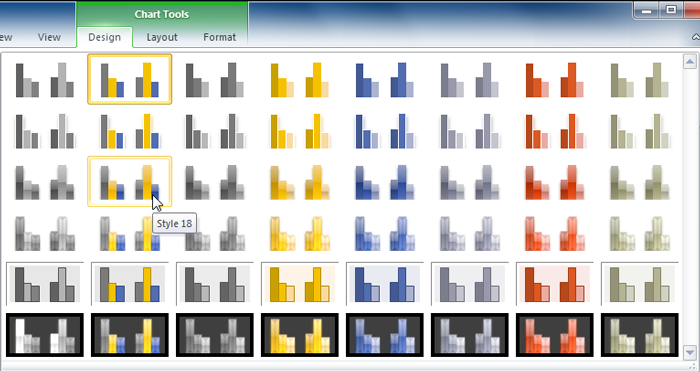 Selecting a new chart style
 - The chart will update to reflect the new style.
 The modified chart


