

Excel 2013
PivotTables
Introduction
Video: PivotTables (Part 1)
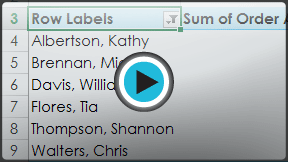 Watch the video (4:36).
Video: PivotTables (Part 2)
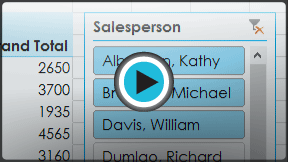 Watch the video (3:29).
When you have a lot of data, it can sometimes be difficult to analyze all of the information in your worksheet. PivotTables can help make your worksheets more manageable by summarizing data and allowing you to manipulate it in different ways.
Optional: Download our Lesson 27 Practice Workbook.
Using PivotTables to answer questions
Suppose we wanted to answer the question: "What is the amount sold by each salesperson?" for the sales data in the example below. Answering this question could be very time-consuming and difficult—each salesperson appears on multiple rows, and we would need to total all of their different orders individually. We could use the Subtotal command to help find the total for each salesperson, but we would still have a lot of data to work with.
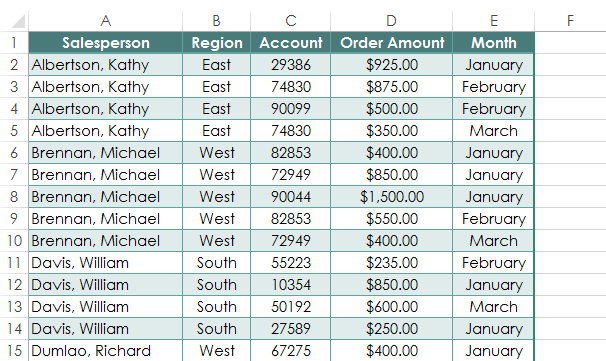 A worksheet containing sales data
Fortunately, a PivotTable can instantly calculate and summarize the data in a way that's both easy to read and manipulate. When we're done, the PivotTable will look something like this:
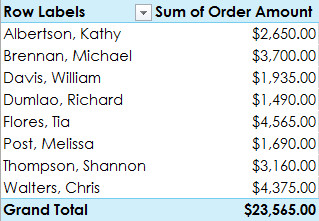 A completed PivotTable
Once you've created a PivotTable, you can use it to answer different questions by rearranging, or pivoting, the data. For example, if we wanted to answer the question: "What is the total amount sold in each month?" we could modify our PivotTable to look like this:
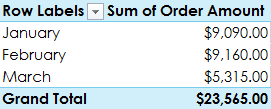 Pivoting data to answer different questions


