

Excel 2013
Charts
To insert a chart:
- Select the cells you want to chart, including the column titles and row labels. These cells will be the source data for the chart. In our example, we'll select cells A1:F6.
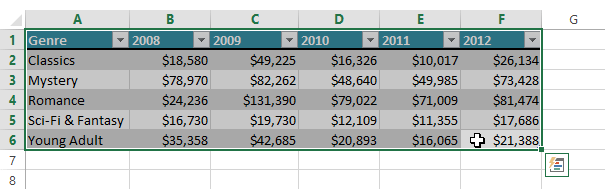 Selecting cells A1:F6
 - From the Insert tab, click the desired Chart command. In our example, we'll select Column.
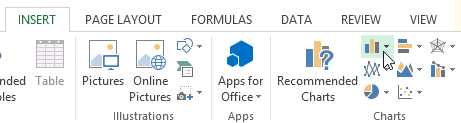 Clicking the Column chart command
 - Choose the desired chart type from the drop-down menu.
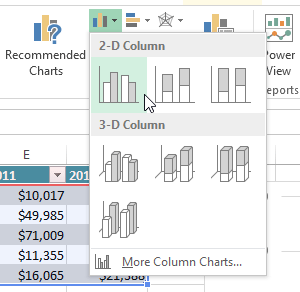 Choosing a chart type
 - The selected chart will be inserted in the worksheet.
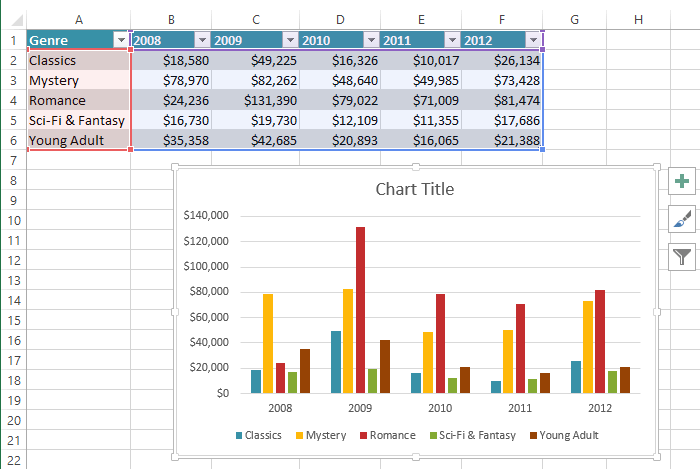 The inserted chart
If you're not sure which type of chart to use, the Recommended Charts command will suggest several different charts based on the source data. 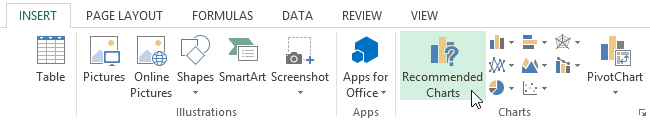 Clicking the Recommended Charts command


