Excel 2003
Creating a Chart
Creating an embedded chart
Charts can be created in either of two ways in Excel 2003: embedded charts and chart sheets. Excel creates an embedded chart by default. An embedded chart is placed on the same worksheet as the source data that was used to create it.
To embed a chart in a worksheet:
- Choose View
 Toolbars
  Chart on the menu bar.
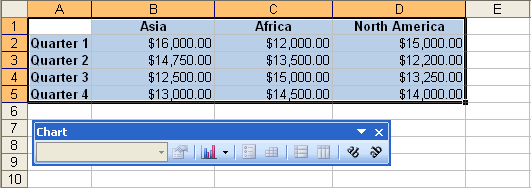
 - Select the range of cells you want to chart. Your source data should include at least three categories or numbers.

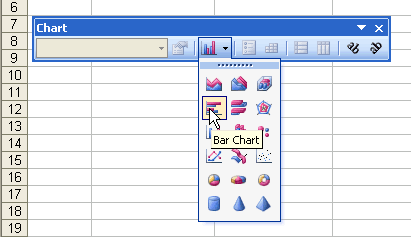
- Click the chart type drop-down menu on the chart toolbar, then select the chart you would like to use.

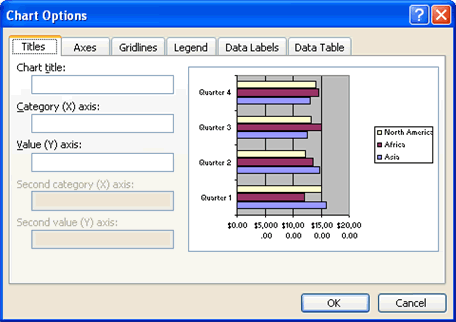
- Open the chart options dialog box: Chart
 Options to add a title to your chart.

- Select the Titles tab, and type the title of the chart in the Chart Title text box.

 Different charts work best with different data. A pie chart, for example, can only display one data series at a time.
 Excel 2003 includes a four-step Chart Wizard you can use to guide you through the steps for creating a chart. Highlight the cell range you want to chart, choose Insert
  Chart on the menu bar, and follow the instructions in the wizard.


